Omicron Research Institute
QuanTek Econometric & Technical Analysis Software
Econometrics & Technical Analysis
Welcome to the Omicron Research Institute home page. Omicron Research Institute is devoted to the study of the relation between Econometrics and Technical Analysis of the financial markets, using established techniques of Digital Signal Processing and Time Series Analysis. The techniques we use are derived from both Technical Analysis and the Random Walk model. These techniques are incorporated in our QuanTek trading and investing software for Windows, designed for the individual or institutional investor or trader. We use QuanTek to maintain our Model Portfolio on this website with various studies of technical analysis and market behavior updated every week. Also on this website is a collection of Articles and Demonstrations about various aspects of the QuanTek program related to Econometrics and Technical Analysis in general.
QuanTek Econometric Software
QuanTek is a new type of trading and investing software that is based on the latest ideas from Econometrics and Time Series Analysis, in relation to Technical Analysis of financial markets. In particular, QuanTek makes extensive use of our proprietary Adaptive (Wavelet) Linear Prediction Filter to make a Price Projection based on long-term correlation in the past price data. From the expected return and risk (volatility) of each security in the portfolio an Optimal Portfolio is calculated and displayed. There is also a Portfolio Report which displays the expected future returns, actual past returns, and risk on various time scales for the securities in the portfolio, along with the results of the Optimal Portfolio calculation. To see QuanTek in action, please see our study of the DJI Index on this page, and our general analysis of the state of the market and Model Portfolio, and listings of the Optimal Portfolio, on the Model Portfolio page.
Main Features of QuanTek
- Price Projection utilizing a Least-Mean Square (LMS) Adaptive Filter and Wavelets
- Innovative scrolling graphs displaying corrected data (2048 days) and trading signals
- Displays historical Price Projections and alternative filters for comparison, toggling graphs
- Bollinger Bands and other trading signals based on Savitzky-Golay (acausal) smoothing
- Causal buy/sell signals and other causal indicators derived from Wavelet smoothing
- Adjustable trading Time Horizon for trading signals, adjustable from 1 to 128 days
- An Optimal Portfolio calculation that maximizes portfolio return while minimizing risk
- Optimal Portfolio and returns on various time scales displayed in a Portfolio Report
- Keeps track of a Model Portfolio, including gains and losses and overall portfolio value
- A Short-Term Trades dialog summarizing portfolio information and trading signals
- A variety of statistical tests, to test the effectiveness of the filters and for general information
- Three independent Help systems, along with helpful information contained in dialog boxes
- Uses Alpha Vantage (free) or EOD Historical Data (inexpensive) data, automatic download
- Available on a subsciption basis--$119 per year--download and try out QuanTek for free!
QuanTek can give you a more realistic view of the long-term trends and short-term fluctuations of the market, enabling you to make more profitable trades. The Bollinger Bands and other features of the Main Graph are very useful for identifying oversold and overbought conditions, helping to identify optimal buy/sell points. The Price Projection is also very useful for separating the long-term trends from the short-term fluctuations in order to see clearly the true state of the market. For a more detailed explanation of the features of QuanTek, please see the QuanTek Features page.
Technical Analysis & Random Walk Model
QuanTek uses sound principles of Econometrics to extend both Technical Analysis and the Random Walk model. For each security, after correcting the logarithmic prices for splits and dividends, a long-term 2048-day trend line is computed. The average daily price range is also computed. The Price Projection is then computed based on these quantities, utilizing our proprietary Adaptive (Wavelet) Least Mean Square (LMS) Filter.
One interpretation of the Random Walk Model is that the Price Projection is given by the extension of the long-term trend line to the future, so the expected future return is the slope of this line. The expected range of prices for future day N is given as the average daily price range multiplied by the square root of N. The Random Walk model postulates that no function of past prices can be a predictor of future returns. On the other hand, Technical Analysis postulates that there exist technical indicators, which are functions of past prices that have predictive power for future returns.
QuanTek uses an Adaptive (Wavelet) Least Mean Square (LMS) Filter to try to determine the best (time-varying) predictors of future returns and arrive at a Price Projection which depends on these predictors. It thus builds on the basic principles of the Random Walk model but goes beyond this model. It also extends the basic principles of Technical Analysis by interpreting the predictors as technical indicators. The effectiveness of this approach is verified by extensive statistical tests.
Statistical Tests in QuanTek
QuanTek has many unique statistical tests that are used to test the Adaptive filters, and also for general Econometric information. In particular, the program contains correlation tests which are used to test the effectiveness of the Price Projection from the Adaptive (Wavelet) Least Mean Square (LMS) Filter. However, these tests are separate from the rest of the program and are not needed for ordinary trading and investing.
Stock Trading and Investing in QuanTek
QuanTek can be used with portfolios of stocks, ETFs, mutual funds, or indexes data. The program keeps track of both an Optimal Portfolio and a Model Portfolio of securities in the same portfolio. You can create any number of portfolios, simply by creating new data files in a new folder. QuanTek uses your choice of two data sources -- AlphaVantage (free) or EOD Historical Data (inexpensive). You can download Historical, Daily, or Intra-day data from either of these sources with a single click of a button. The data are parsed and stored in the data files for each portfolio automatically. You can also parse CSV files in a variety of formats, and also export CSV files. For more information on available data sources, see the Database Data page on the Download QuanTek page.
Study of Dow Jones Industrials Index
Please see our study of the DJI Index, updated weekly, below on this Home page. Here is a link to it:
This study displays graphs of the Dow Jones Index on all five QuanTek scales, so that both the short-term and long-term price action of the index can be studied. These graphs all use prices that are corrected for splits and dividends, displayed on a logarithmic scale. The aspect ratio is the same on all graphs, so the slopes of all the graphs, or returns, can be compared directly. The volatility can also be compared directly between different securities on the same scale, by means of the Bollinger Bands, which is sometimes a stark reminder of the widely varying levels of risk involved with different securities. This kind of direct comparison is hard to obtain with the more usual formats for displaying graphs.
Model Portfolio Page
We have started a Model Portfolio page with a Portfolio Report containing a listing of the portfolio, along with many screen shots of the securities in the Optimal Portfolio, including indexes. We plan to do model trading in the portfolio every weekend at the close price for Friday. You may view the graphs and discussion, and the Portfolio Reports, for the past several weeks, here on the Model Portfolio page:
In the Portfolio Report you can view both the Model Portfolio and the Optimal Portfolio. The Optimal Portfolio, which consists of all the securities we are tracking at the moment, is optimized based on the expected return from the 2048-day Long-Term Trend, along with the risk based on the measured average absolute deviation of the prices. We also take into account the Price Projection in our Buy/Sell decisions, as well as other general features of the graphs including Technical Analysis, and our general knowledge of the markets and current events.
QuanTek Features Page
The QuanTek program is sophisticated and has many interesting features. For a more detailed explanation of the features of QuanTek, please see the QuanTek Features page:
This page containes a detailed description of the features of QuanTek, including studies of the graphs (Scales 1,2,4,8,16), and the Price Projection. This is followed by an explanation of the three Indicator (Splitter) Windows, which show additional important indicators related to the Price Projection. From these are derived the Buy/Sell Signals, Buy/Sell Points, and also the Long/Short Signals. This is followed by an explanation of the Optimal Portfolio, along with the two main methods of viewing it which are the Portfolio Report and Short-Term Trades dialog. Following this are explanations of the four types of Statistical Tests, which are the Correlaton--LP Filters/Indicators, Scatter Graph Indicators/Returns, Wavelet Analysis/Variance, and finally the Periodogram/Wavelet Spectrum. Also there is a History of the QuanTek program.
Download QuanTek Page
At present the QuanTek program is packaged with two separate executables, written for Alpha Vantage and for EOD Historical Data. You can download the latest version of QuanTek from the Download QuanTek page here:
You can download and try out the program without a license using the Sample Files provided. You can then purchase a one-year license for $119, which is valid for all updates during the subscription period, using the PayPal button on this page.
Technical Articles Page
Please explore the articles about QuanTek listed on the Technical Articles page. These articles explain the theory behind the QuanTek program, as it relates to Modern Portfolio Theory as well as the application of Signal Processing techniques and Wavelet Analysis to financial time series:
Some of the articles listed also appear in the QuanTek Help file, which you can view by downloading QuanTek. You can also find more detailed information about QuanTek in the Help file.
QuanTek Demos Page
You can find a set of detailed demonstrations of QuanTek listed on the QuanTek Demos page. These are generally numerical correlation tests of the Price Projections and Trading Rules:
Please view the latest correlation tests of the Default Adaptive Filter on this page. These demonstrations are a set of detailed tests of the performance of the QuanTek program. They also explain in detail how the QuanTek program works and how to use it effectively.
Email Us Page
If you are interested in purchasing a QuanTek subscription or you would like more information, please send us an e-mail using the form on the Email Us page:
We would also like to hear any and all feedback regarding how you like the QuanTek program, suggestions for improvements, complaints, or if you find any bugs in the program.
Dow Jones Industrials (.DJI) (2019-04-26)
Here is shown the latest set of QuanTek graphs of the Dow Jones Industrial Index, updated every weekend. The graphs are shown on all five QuanTek scales. The unique feature of these graphs is that they clearly display the long-term trend, on a logarithmic scale, due to using prices that are corrected for splits and dividends. (Of course, this applies only to stocks. For an index there is no correction for the values of the index.) This enables the true picture of the price action to emerge, including the long-term trend and any deviations from the trend.
Of course, the DJI is an index and as such, is very efficient, so the index stays very close to its long-term trend and the volatility, indicated by the Bollinger Bands, is very low. The long-term trend is very reliable, and generally the Price Projection stays very close to it. (This just means the market is efficient.) However, oversold and overbought conditions do occur from time to time, and these represent ideal opportunities to buy and sell. These conditions are clearly displayed in terms of corrected prices using the Bollinger Bands and Long-Term Trend Line.
The graphs shown below of the Dow show the smooth recovery from the selling climax of December, all the way until the beginning of March. The past six weeks have witnessed a recovery from the moderate decline in the Dow, from the previous week. So it must have been a temporary reaction to a news event. Most securities have done well the past six weeks. At any rate, prices are very near their equilibrium values, neither overbought nor oversold. The expected return from the Price Projection is at 9.97% (annualized), a little less than the 2048-day average return of 10.62%. Perhaps the selling climax was the tail end of a (mild) six-month bear market, and the market has now returned to its normal long-term trend. It appears now to be fluctuating (slightly) about this long-term trend line.
Dow Jones Industrials (.DJI), Scale 16:
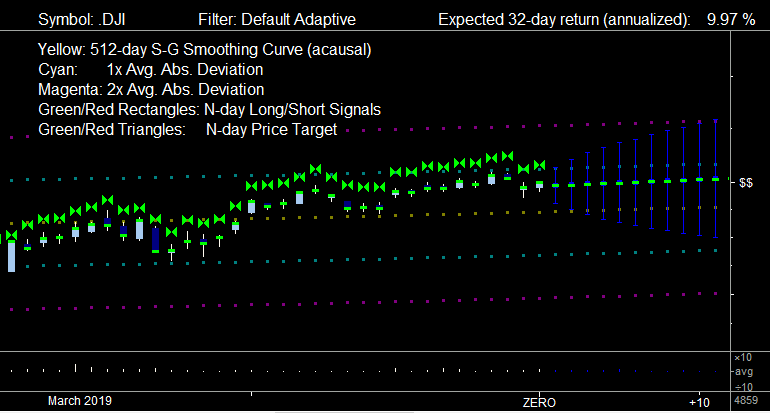
This is the largest scale, good for studying the daily price action. The green rectangles indicate favorable points to be long, and the green double-triangles indicate the 32-day Price Target. (This is the Price Projection, 32-days out. These indicators can be toggled on or off to better see the underlying price action.) Note that the Price Target is always relative to the current price, in accord with the Random Walk model.
Dow Jones Industrials (.DJI), Scale 8:
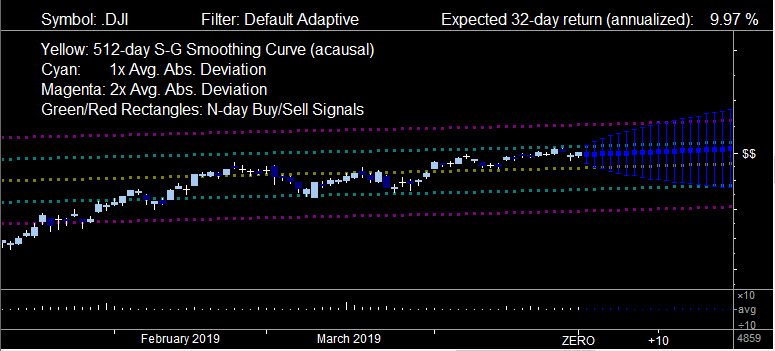
The highest two scales show the Candlesticks, which indicate the open price along with the high, low, and close prices. There are no Buy/Sell signals shown in this graph, but these are based on the Relative Price indicator with low-pass smoothing. These will be the optimal points for a Buy-Low, Sell-High strategy, taking account of the price fluctuations at a scale of 32-days and longer. The Bollinger Bands indicate oversold/overbought conditions. These are acausal indicators, meaning they depend on future prices as well as past prices, but they have no time lag.
Dow Jones Industrials (.DJI), Scale 4:
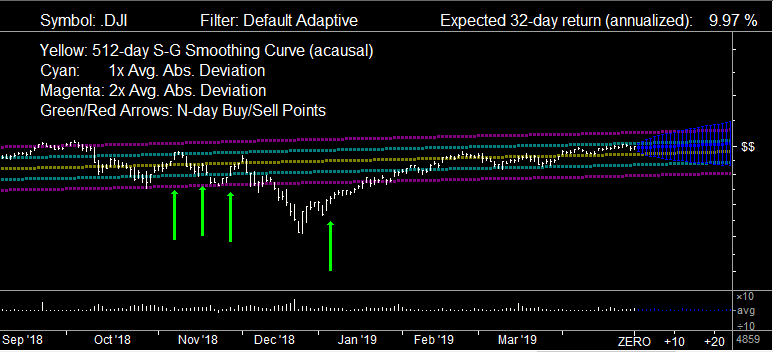
This scale uses the usual representation of high, low, and close prices. The yellow curve and surrounding Bollinger Bands are based on a 512-day Savitzky-Golay smoothing curve, which is acausal. This is good for indicating oversold/overbought conditions on a 512-day scale. This graph also shows 32-day Buy Points, which are the green arrows. These are based on the Relative Price indicator with band-pass smoothing. These indicators may be useful for swing trading on a 32-day time scale, though they do not take into account the longer-term price fluctuations, which might be more important.
Dow Jones Industrials (.DJI), Scale 2:
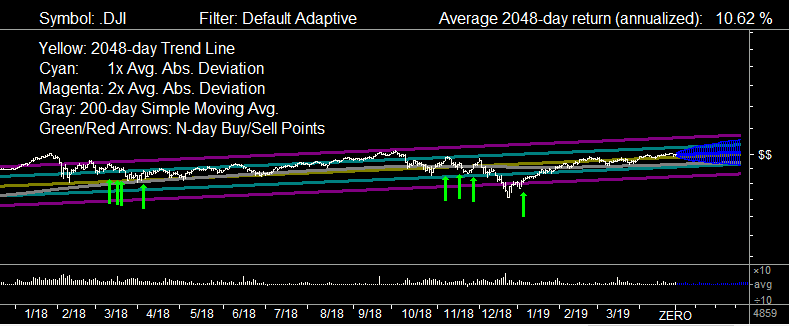
On this scale, the long-term price action becomes more apparent. The yellow line is now the 2048-day (robust) Trend Line. This is good for indicating oversold/overbought conditions on a 2048-day scale. This scale also shows a 200-day Simple Moving Average in gray of prices (relative to the long-term trend line). On this scale it starts to become clear that even serious corrections are actually not very significant compared to the long-term trend. This fact might be hard to appreciate when looking only at short-term, linear graphs that do not scale proportionally.
Dow Jones Industrials (.DJI), Scale 1:
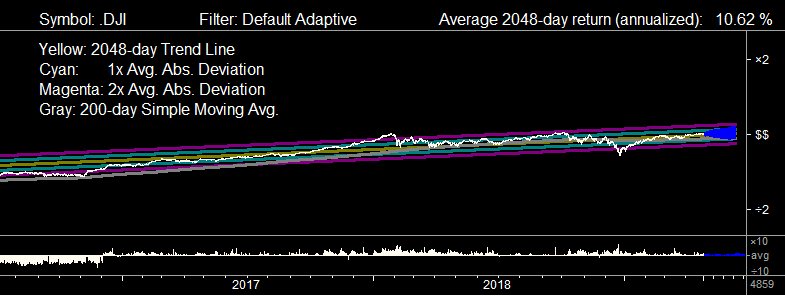
Finally, we arrive at the lowest scale, with 1 pixel per trading day. This gives a panoramic view of the price action, which is made possible by the use of corrected prices, which reveals the true price action or value of the security. On this scale, the whole 2048 days of data are displayed at once on a single graph, if your screen is at least 2048 pixels wide. This once again shows that even seemingly serious corrections are actually relatively minute compared to the long-term trend.
- Software Designer
- Dr. Robert Murray
- Mailing Address
- 8063 N Stoddard Ave., Kansas City, MO 64152-2025
- Phone (cellular)
- (816) 695-1334
As always, "Past performance is no guarantee of future results."
Please read and understand the Disclaimer here: View Disclaimer