Omicron Research Institute
QuanTek Econometric & Technical Analysis Software
QuanTek Optimal Portfolio
The Optimal Portfolio in QuanTek is computed using a modified Markowitz Method. The Markowitz Method of portfolio optimization is familiar from Modern Portfolio Theory. This method makes use of the estimated expected return for each security in the portfolio, and also the covariance matrix of the returns between all the securities in the portfolio. Then the goal is to find the proportion of each security that maximizes returns for the overall portfolio, and which also minimizes risk. The risk or volatility is defined as the standard deviation (square root of variance) for the portfolio returns, but for our purposes we use the average absolute deviation. The portfolio covariance matrix is obtained by measuring the volatility of each security and the correlation of the returns between all the securities in the portfolio. The Markowitz Method computation is a complex one in linear programming in general, but in QuanTek a modification to this procedure is made to make the calculation more suitable for the QuanTek program. The Portfolio Optimzation method that we use is described in the article Portfolio Optimization in QuanTek on this website and in the Help file. For the Portfolio Optimzation calculation you can set the percent margin invested, and the risk tolerance, the opposite of risk aversion, to adjust the optimization of the portfolio for different desired ratios of overall portfolio return to risk. On the low-risk tolerance setting, the optimal portfolio takes into account the volatility, while on the high-risk tolerance setting the proportions of the securities in the portfolio are roughly the same as the proportions of the expected returns alone.
The Optimal Portfolio must be computed each time the QuanTek program starts. This is because it changes each time new data are downloaded. After downloading new data, it is important to make sure the Price Projections are updated for each security. You must do this by opening each security so the Price Projection calculation runs. Actually, the Optimal Portfolio does not depend on the Price Projections, but the Price Projections are displayed in the Portfolio Report. After computing the Optimal Portfolio, you can then see the result immediately in the Portfolio Report. You can also see it in the Short-Term Trades dialog.
Portfolio Report
The Portfolio Report is an RTF file that you can display at any time (after computing the Optimal Portfolio). It shows the securities in the current Portfolio folder along with the past returns on several time scales, the future expected return on the chosen trading Time Scale, and the standard deviation (volatility). Next it displays the model portfolio which consists of the number of shares long or short of each security "owned", the market value of the shares, the actual price, and the basis price. Next some portfolio information is displayed such as the account equity and the total long and short market value. Finally the optimal portfolio is displayed with the number of shares of each security and percentage of equity, to compare with the corresponding numbers in the model portfolio. It also displays the Sharpe Ratio for each security, which is a measure of the ratio of expected return to risk. Finally the results of the Optimal Portfolio calculation for the overall portfolio as a whole are displayed, consisting of the Expected Return and Standard Deviation for the whole portfolio, along with the Margin Leverage. All this information is extremely useful for making trading decisions. The RTF file can be saved to disk and consulted later.
For some examples of the Portfolio Report, see the Model Portfolio page on this website.
Short-Term Trades Dialog
The Optimal Portfolio information is summarized in a handy dialog box called the Short-Term Trades dialog. This dialog is available from the MainFrame toolbar, or anywhere in the program just by clicking the Alt key:
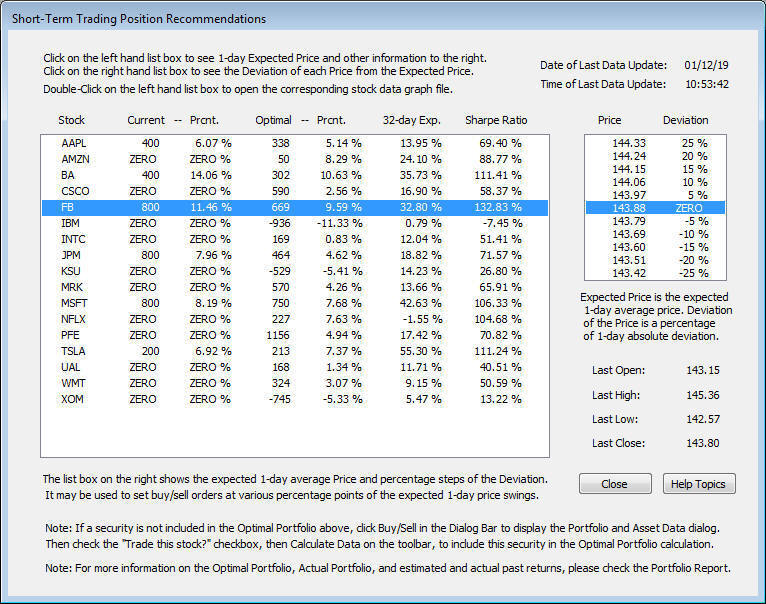
This dialog shows all the most pertinent information for short-term trading decisions. Each security in the portfolio folder is displayed (except indexes). They are all included in the Optimal Portfolio calculation unless the "Trade this stock?" check box in the Portfolio and Asset Data dialog is unchecked. The columns show the Current (Model) Portfolio shares and percent of equity, the Optimal Portfolio shares and equity, the N-day expected return from the Price Projection, and also the Sharpe Ratio. This latter is the ratio of the (2048-day) expected return to the (2048-day) average standard deviation of the securities. This is a very important measure of the ratio of return/risk for each security, and a good criterion for the "quality" of the security as a long-term investment.
On the right is an interesting list box showing a list of Prices and their corresponding Deviation. What this means takes a little explanation. Clicking on a security line on the left displays a list of prices of the security on the right. Below the list box are the Open, High, Low, Close prices for the latest past day. The average price is the average of these four prices. Then the Standard LP filter is used to estimate an expected average price for the next day, and this is displayed in the center (highlighted) of the list box. Then, using the average absolute deviation over the past returns, a list of prices and their deviation from the expected average price is displayed in the list box. Clicking on any line in this list box brings it to the center of the box. You can then use this list box to set day limit orders based on the expected average price and expected deviation (range) of the prices. So, for example, the estimated range of tomorrow's prices correspond to the +100% and -100% prices in the list box. So, if you are a day trader, you may find this feature useful.
Go back to QuanTek Features